Some time ago, I created the following graph, juxtaposing annual Danish wind energy production and total CO₂ emissions from 1996 to 2006. The CO₂ emissions are on a reverse scale so that as they decrease the line would parallel an increase in wind production. But as can be seen, while wind production rose dramatically, CO₂ emissions remained essentially flat.
A related graph in the latest annual Energy Statistics report from Denmark (p. 37) shows two different measures of CO2 emissions just in electricity generation (below). The blue line is CO₂ emissions per fuel unit, which steadily declines as natural gas replaced oil and combined heat and power is increasingly used. But in the later 1990s the amount of CO₂ emissions per unit of electricity generated (the red line) starts to decrease at a slower rate, dramatically so after 1999.
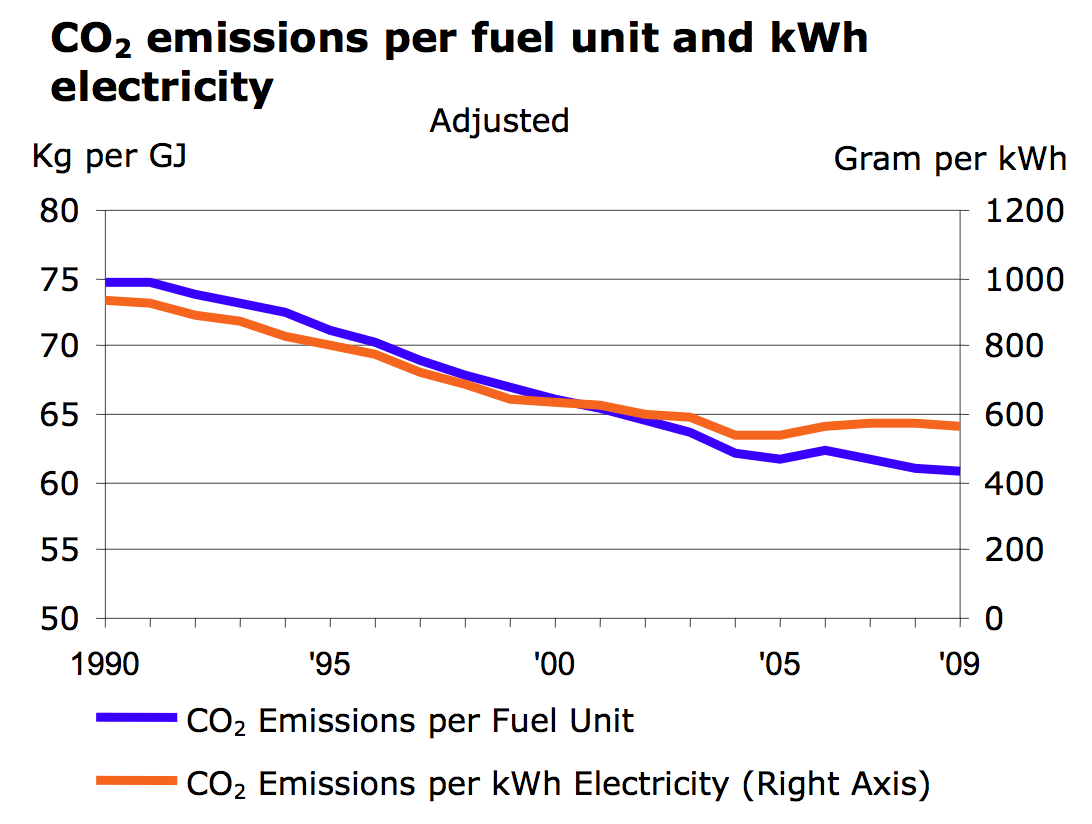
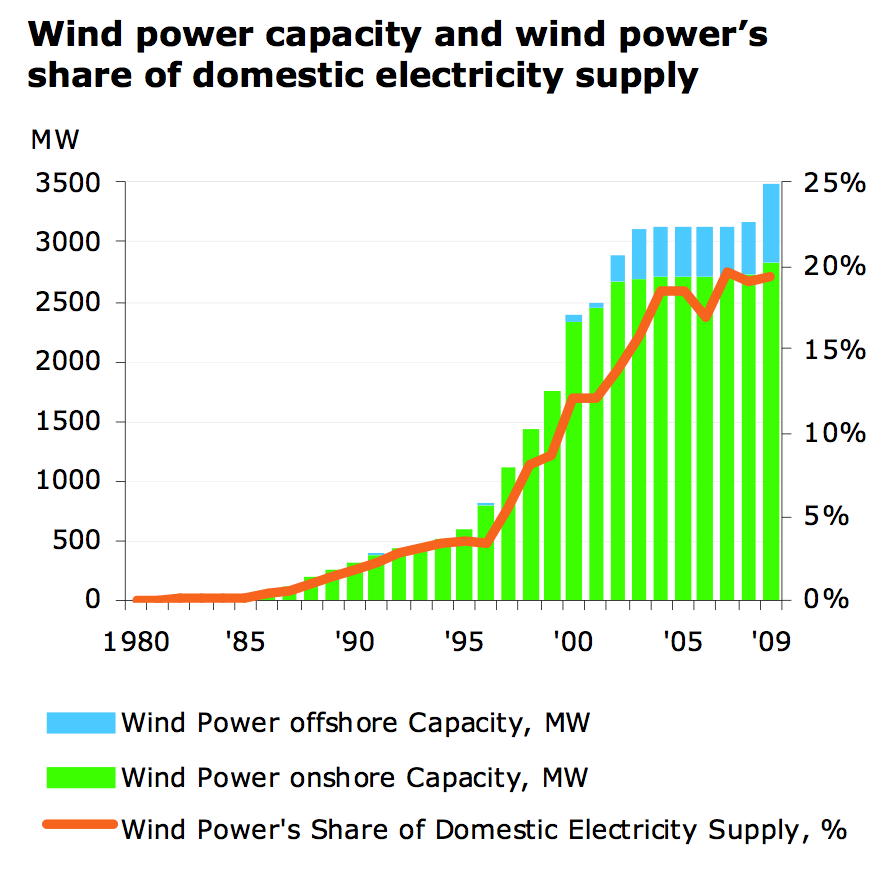
This indicates that more fuel is being burned, or being burned less efficiently, per unit of electricity produced since the 1990s. And that phenomenon corresponds with the build-up of wind energy, as shown in the graph below, from page 9 of the same report.
tags: wind power, wind energy, environment, environmentalism